You might have already noticed that the debt-to-income ratio, as reported quarterly by Statistics Canada, has been on the rise since a while ago, and it has reached a new record of 163.7% in the third quarter of 2015. (The following italicized paragraphs are all excerpts from The Daily released on Monday, December 14, 2015 by Statistics Canada:
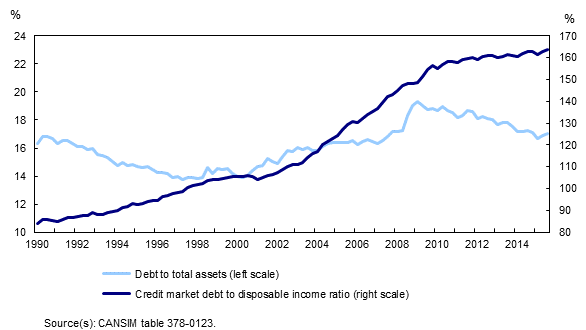
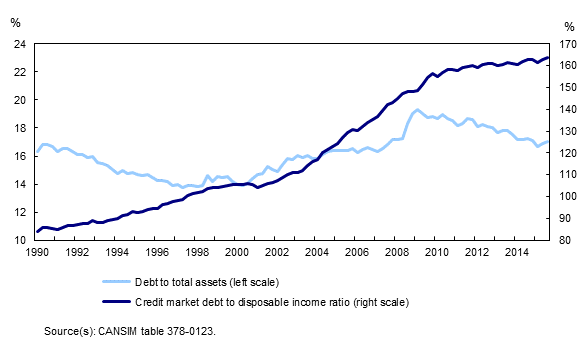
Leverage, as measured by household credit market debt to disposable income (excluding pension entitlements), rose to 163.7% in the third quarter from 162.7% in the second quarter. In other words, there was $1.64 in credit market debt for every dollar of disposable income. Disposable income increased at a slower pace (+0.8%) than household credit market debt (+1.4%).
The following graph shows the trend of the rising debt to income ratio from 1990.
The rising debt to income ratio has always been a headline grabber. Search in the news for debt-to-income ratio and you will find almost all major news media mentioned the record-making ratio:
CBC: Debt-to-income ratio rose to 163.7% in third quarter, Statistics Canada says
Reuters Canada: Canadian household debt-to-income ratio hits record high in third quarter
The Star: Average Canadian household owes $1.64 for each dollar of annual income
Bloomberg: Canada Debt-to-Disposable Income Ratio Climbs to Fresh Record
In the same document, the two immediately preceding paragraph read:
The ratio of total household debt to total assets edged up in the third quarter to 17.0%. Since 2009, this ratio has been on a general downward trend, as the growth in the value of assets has outpaced debt. This ratio now sits between the peak of 19.3% recorded in the first quarter of 2009 and the low of 13.8% in the second quarter of 1997.
Total household credit market debt (consumer credit, and mortgage and non-mortgage loans) reached $1,892 billion at the end of the third quarter, up 1.4% from the previous quarter. Consumer credit debt was $572.3 billion, while mortgage debt stood at $1,234 billion.
Aha! If you own 100 dollars and owe the bank 17 dollars, you are quite all right. Continue read further,
The household debt service ratio, measured as total obligated payments of principal and interest as a proportion of disposable income adjusted to include interest paid, decreased to 13.6% in the third quarter. The interest-only debt service ratio, defined as household mortgage and non-mortgage interest paid as a proportion of disposable income, reached a record low 6.1%.
So even if the debt to income ratio is 163.7%, or in other words, for every dollar Canadians bring home, they owe $1.64. Does that sound scary to you? If you make $100,000 after income tax (that’s pretty much the definition of disposable income), do you care if you owe the bank $163,700 on your house? By the way, the $163,700 is only 17% of your total assets, which happen to be about $963,000.
We will have to look at the debt to income ratio from Statistics Canada from its own perspective. It might not be very useful to any individual for their daily financial planning. Don’t forget the title of the StatCan document is titled: National balance sheet and financial flow accounts, which talks about the indebtedness of Canadians on a whole. Just to give my readers some perspective, I would be very very happy if my debt to disposable income ratio is 163.7%. Last time I checked, my household debt to disposable income is about 300%. And I am not worried. At least not losing much sleep over that.
That debt service ratio might be more meaningful. It better reflects one’s ability to meet their obligations when they come due. The banks usually require a debt service ratio of 30 to 40% before granting a mortgage.
 ReFocusTax.ca Canadian Income Taxes DIY


